QUANTITATIVE ANALYSISBA SOCIAL SCIENCESUNIVERSITÉ PARIS CITÉ2023 · 2024
PLAYING IN FRANCE
Who plays video games in France, and what changes the odds?
A statistical study of the national survey on the cultural practices of the French (2018): 9,234 people aged 15 and over. I tested four common ideas about gamers, one by one: who plays, how often, and whether playing pushes out other cultural practices such as reading or going out.
Individual assignment · BA in social sciences · 2023-2024
PCF 201844 %OF PEOPLE AGED 15+ PLAYED IN THE YEARPRESS START
BA
PRESS START · READ IT IN TWO MINUTES
9 234respondents aged 15 and over, interviewed by the Ministry of Culture
44 %of people aged 15+ played in the year, once the sample is weighted (38.8% raw)
81 % · 18 %of 15-25 year-olds against over 60s: age is the main divide
4common ideas about gamers tested; three turn out false
THE QUESTIONWhat place do video games hold in the leisure of the French, how does it vary across social groups, and does playing take time away from other cultural practices?
MY ROLEIndividual work from start to finish: research question, choice and recoding of the variables, frequency tables, cross-tabulations, chi-square tests, interpretation with research articles. The worlds marked BONUS go further with the same data: weighting, frequency of play, players compared with non-players at the same age, logistic regression.
WHAT IT SHOWSAge is by far the strongest divide. Men play a little more often than women, but the women who play are more likely to play every day. And players are not withdrawn: at the same age, they read as much as non-players and go to the cinema more.
WHY IT MATTERS FOR DESIGNThe "typical player" that games are often designed for, a young man playing at home, is one profile among many. The most regular players include women aged 40-60 and players over 60.
WORLD 1THE QUEST
Four common ideas about gamers, to test one by one.
My starting point: how do video games fit into the cultural practices and leisure of the French? Video games are the cultural good that grew fastest at the end of the 20th century, and they come with a strong image: a young man, alone in front of a screen, who has stopped reading and going out. Rather than take this image for granted, I turned it into four claims the survey can test.
QUEST LOG
1"Gamers are young men." · WORLD 4 · 5? TO BE TESTED
2"The more educated you are, the more you play." · WORLD 4 · 9? TO BE TESTED
3"Video games take the place of books." · WORLD 7? TO BE TESTED
4"Players stay at home." · WORLD 8? TO BE TESTED
THE SURVEYCultural practices of the French, 2018, run by the Ministry of Culture through face-to-face interviews. People living in France aged 15 and over, 9,234 respondents, analysed with the survey software used in class.
LEBAILLY (2015)Video games in cultural globalisation: from 1983 to the late 1990s, Japan led the industry and shaped what a game was, and who it was made for. Useful to understand where the "young male gamer" image comes from.
RUFAT, TER MINASSIAN & COAVOUX (2014)Playing video games in France: a social geography of the practice, which already showed that playing is widespread but unequal, and that age structures it more than anything else.
WORLD 2THE METHOD
From the raw table to the controlled effect, in five steps.
01Frequency tablesDescribe each variable alone: how many play, how often, who is in the sample.
02Cross-tabulationsCompare the share of players across groups: women and men, age groups, diplomas.
03Chi-square and VChi-square says whether a gap is more than chance; Cramér's V, from 0 to 1, says how strong it is.
04Same age, same sexCompare players and non-players within each age group, then with a logistic regression, so that age does not hide behind another factor.
05WeightingCorrect the sample so that each age group weighs what it weighs in the population.
THE VARIABLES USED
B1Played video games in the last 12 months, on any device
B2How often they play
F5 · F16Calls themselves a big, average or small reader · genres of books read
G3A · H2Went to the cinema · other outings in the year
C15Watches videos on the Internet
SEX · AGE · DIPLOMAThe three factors that might explain who plays
HOW TO READ THE SCREENSEach bar is a health bar drawn to scale: 20 cells = 100%. The figure on the right is the percentage, n is the number of people it is calculated on. Green and pink bars compare two groups, such as players and non-players. The line below each screen gives the test: "p < 0.001" means the gap has less than one chance in a thousand of being due to chance.
FROM MY BA DOSSIER · EXTRACTS
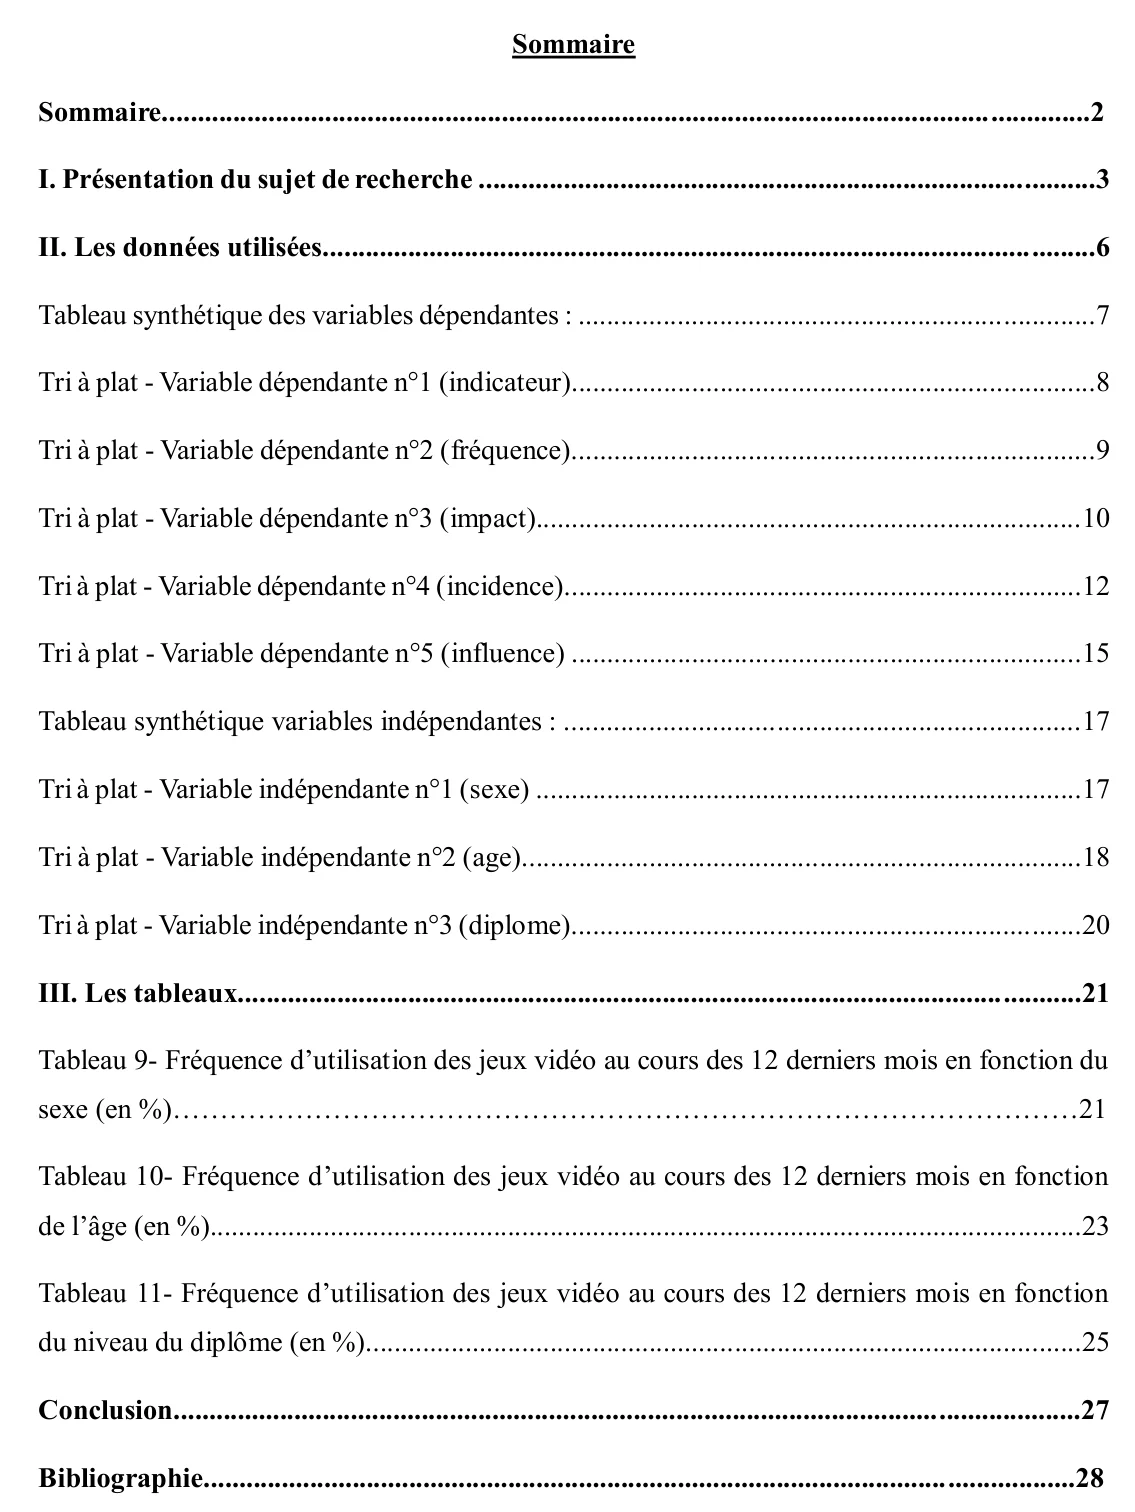
THE STRUCTURE · 28 PAGESResearch question, data, then one frequency table per variable before any cross-tabulation. The order of the method is the order of the dossier.
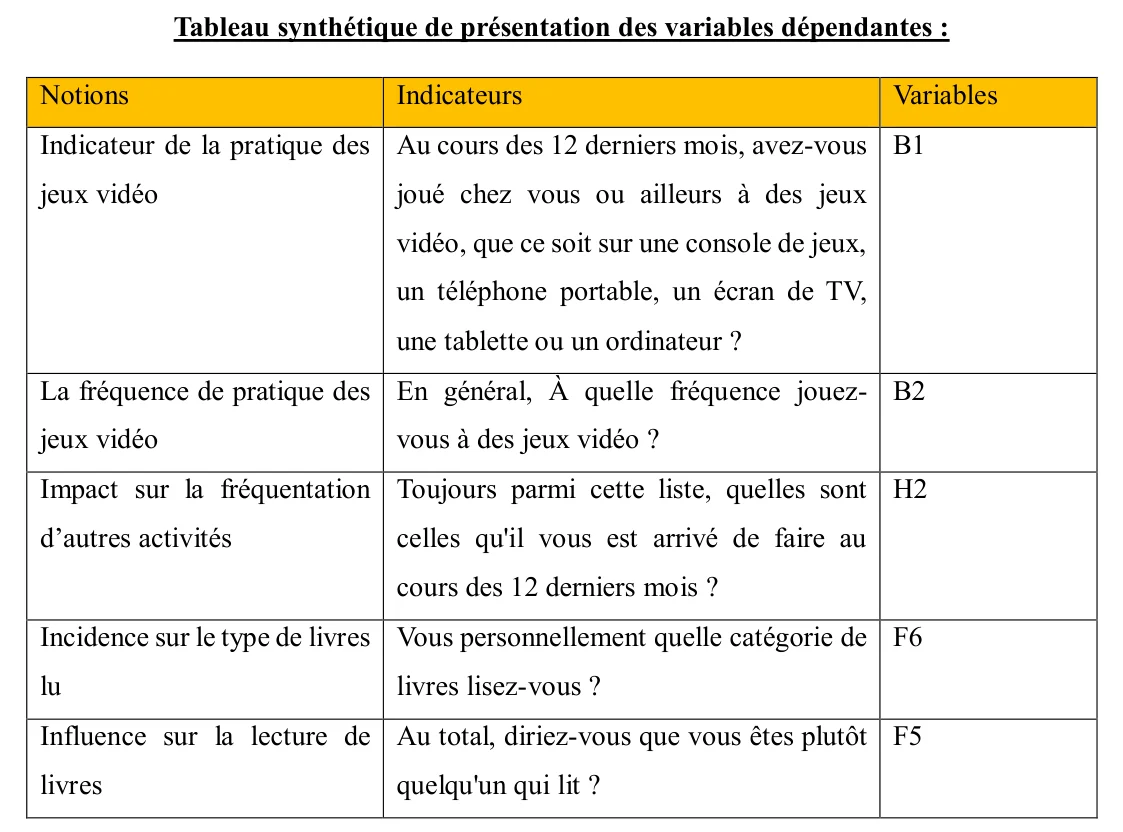
FROM NOTION TO QUESTIONEach notion of the research question is tied to an indicator, then to the exact question of the survey. This is the step that turns a vague idea into something measurable.
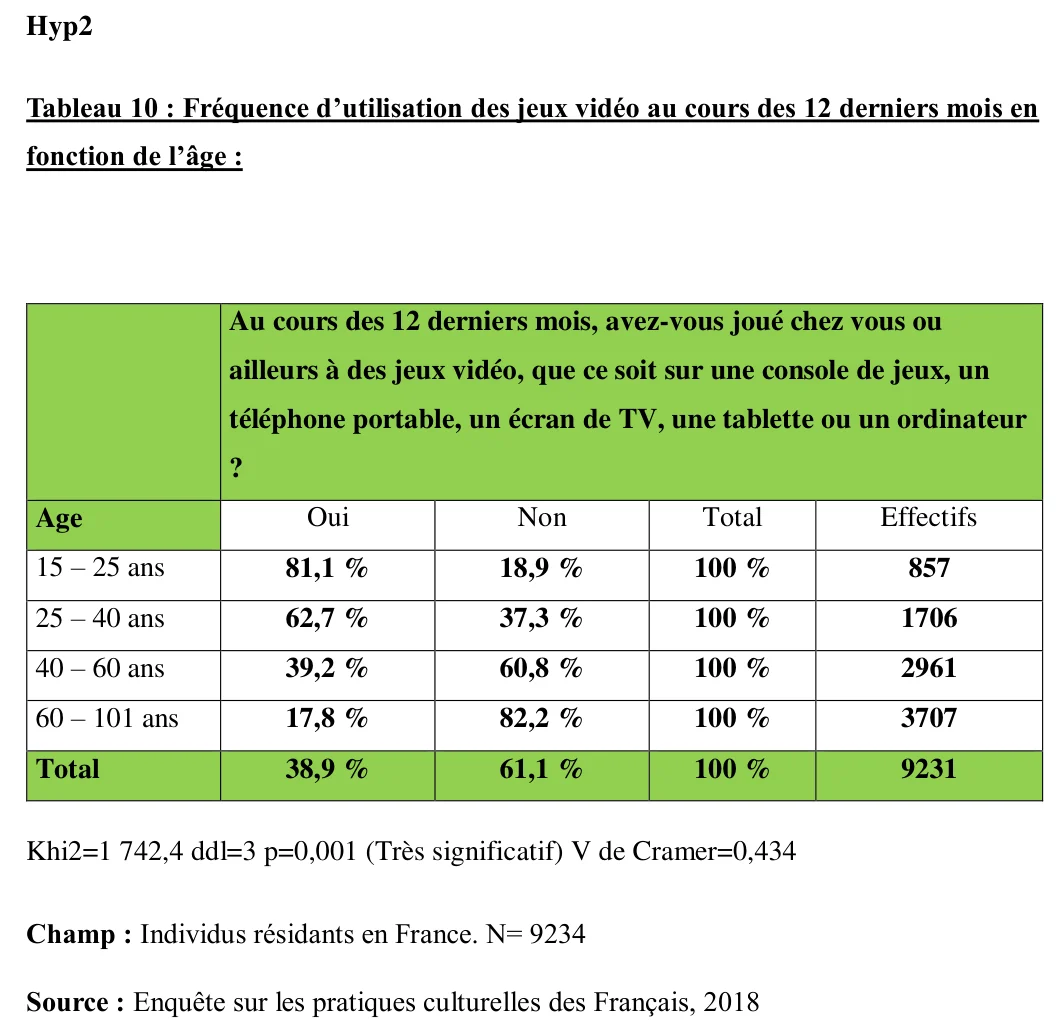
A CROSS-TABULATION AS DELIVEREDTitle, percentages in rows, totals, counts, then the test, the field and the source under the table: the presentation rules of a quantitative report.
WORLD 3FREQUENCY TABLES
38.8% in the sample, 44% in France: the sample is older than the country.
The first figure to come out of the table is 38.8% of players. But a survey sample is never a perfect copy of the population. Here, people over 60 make up 40% of respondents, against 31% of the French aged 15 and over. Since they play much less, the raw figure underestimates the practice. Once each age group is given its real weight, the share of players rises to 43.8%, the 44% published by the Ministry.
WHO IS IN THE SAMPLE · % OF RESPONDENTS
Raw sampleWeighted (France)
15-25
Raw sample9,3 %
Weighted (France)14,2 %
25-40
Raw sample18,5 %
Weighted (France)22,3 %
40-60
Raw sample32,1 %
Weighted (France)32,4 %
60+
Raw sample40,2 %
Weighted (France)31,1 %
The over 60s are over-represented, the 15-25s under-represented.
B2 · HOW OFTEN THE 3,587 PLAYERS PLAY
Every day or almostn = 134737,6 %
3-4 days a weekn = 45812,8 %
1-2 days a weekn = 68019,0 %
1-3 days a monthn = 46713,0 %
Less oftenn = 63517,7 %
Among players only. 69% play at least once a week.
WHAT THE CHART SHOWSLeft: the sample has more older people than France does. Right: among those who played in the year, more than a third play every day or almost, and fewer than one in five plays less than once a month.
WHAT IT MEANSTwo lessons. A raw percentage depends on who answered: the cross-tabulations by age, which compare like with like, are more reliable than the overall figure. And video games are not an occasional hobby for most players: it is a habit, often a daily one.
H2 · OTHER OUTINGS IN THE YEAR · EVERYONE
Historic monument36,0 %
Museum or exhibition28,9 %
Funfair28,3 %
Zoo or animal park25,1 %
Theme park14,7 %
None of these28,9 %
Base: 9,101 people who answered. Used later to compare players and non-players.
WORLD 4THREE HYPOTHESES
Age wins by a wide margin; education does not play the way I expected.
Three classic hypotheses from the sociology of cultural practices: men play more, young people play more, the most educated play more. Each one is a cross-tabulation between having played in the year and a social factor.
LEVEL 1Men play more than women
% who played in the year
Womenn = 507136,0 %
Menn = 416042,3 %
Chi² = 37.7 · df 1 · p < 0.001 · V = 0.064
CONFIRMED · WEAKSignificant, but six points: women are not a marginal public.
LEVEL 2Young people play more
% who played in the year
15-25n = 85781,1 %
25-40n = 170662,7 %
40-60n = 296139,2 %
60+n = 370717,8 %
Chi² = 1,742.4 · df 3 · p < 0.001 · V = 0.434
CONFIRMED · STRONGBy far the strongest link of the study, with a steady decline at each age group.
LEVEL 3The most educated play more
% who played in the year
No diploman = 231029,9 %
CAP, BEPn = 223336,1 %
Bacn = 169749,0 %
Higher educationn = 299142,1 %
Chi² = 172.2 · df 3 · p < 0.001 · V = 0.137
NOT AS STATEDLinked, but the peak is at the baccalaureate, not in higher education.
WHAT THE CHART SHOWSAll three gaps are significant, but their strength varies sevenfold: Cramér's V is 0.06 for sex, 0.14 for diploma and 0.43 for age. Four in five 15-25 year-olds played in the year, fewer than one in five over 60s.
WHAT IT MEANSVideo games are first a matter of generation: today's 60-year-olds did not grow up with consoles, today's 20-year-olds did. The "young" half of quest 1 is confirmed; the "male" half is much weaker. As for diploma, the baccalaureate peak raises a question: bac holders are younger on average. World 9 checks whether it is really the diploma, or age in disguise.
WORLD 5BONUSHOW OFTEN
Fewer women play, but the women who play are more regular.
Having played once in the year says little about the place of the game in someone's life. So I looked at frequency among the 3,587 players only: who plays every day or almost?
% OF PLAYERS WHO PLAY EVERY DAY OR ALMOST
WomenMen
15-25
Women23,3 %
Men38,6 %
25-40
Women33,0 %
Men29,7 %
40-60
Women45,5 %
Men29,3 %
60+
Women58,8 %
Men47,2 %
Players only, n = 3,587. All ages: women 41.1%, men 33.9%.
ALL PLAYERS · EVERY DAY OR ALMOST
15-25n = 69531,5 %
25-40n = 107031,3 %
40-60n = 116137,3 %
60+n = 66154,5 %
THE TESTAt the same age, a woman who plays is 1.27 times more likely than a man who plays to play every day (odds ratio, 95% interval 1.10-1.45, p < 0.001).
WHAT THE CHART SHOWSAmong the 15-25s, young men play daily more often than young women. From 40 onwards, the order reverses: 45.5% of women players aged 40-60 play every day, against 29.3% of men. And the over 60s who play are the most regular of all: more than half play every day.
WHAT IT MEANSThe image of the gamer is built on the youngest players. Among adults, daily play is above all female and senior: most likely short games on a phone or tablet, part of the daily routine. These players are often the least visible in the gaming world, and the least likely to call themselves "gamers".
WORLD 6BONUSON WHAT?
A third of players have no console at home.
The survey asks people what they play on, but this question was not in the data I worked with. It does contain the equipment present in the household: home console, handheld console, computer, tablet, smartphone. Without a console at home, people who play at home do so on a phone, a tablet or a computer. This is an indirect measure: it says what people have, not exactly what they use.
% OF PLAYERS WITH A CONSOLE AT HOME (HOME OR HANDHELD)
WomenMen
15-25
Women71,7 %
Men86,1 %
25-40
Women79,0 %
Men77,2 %
40-60
Women63,1 %
Men71,7 %
60+
Women17,2 %
Men23,4 %
Players only, n = 3,587. All players: 64.1% have a console at home.
DAILY PLAYERS WITH NO CONSOLE AT HOME
15-25n = 21915,5 %
25-40n = 33520,3 %
40-60n = 43336,0 %
60+n = 36081,4 %
Women: 48.3% · men: 31.7%.
EQUIPMENT IN PLAYERS' HOMES
Smartphone97,9 %
Laptop76,3 %
Tablet64,9 %
Home console58,7 %
Handheld console34,7 %
% WHO WATCH VIDEOS ABOUT GAMES · AMONG ONLINE VIDEO VIEWERS
PlayersNon-players
15-25
Players32,3 %
Non-players2,2 %
25-40
Players16,9 %
Non-players0,2 %
40-60
Players5,8 %
Non-players0,4 %
60+
Players1,3 %
Non-players0,8 %
Among players: men 24.3%, women 7.7%. Streams, tests, let's plays: the visible culture of gaming.
WHAT THE CHART SHOWSAlmost all players have a smartphone, two thirds a console. But the older the player, the rarer the console: among daily players over 60, four in five have none at home, and almost half of women who play daily have none either. Conversely, watching videos about games is a matter of young male players: a third of 15-25 players, almost no one after 40.
WHAT IT MEANSThis explains why the image of the gamer is so male and so young: it is built on the most visible part of the practice, consoles, streams and game culture. The most regular players, women in their forties and players over 60, mostly play without a console, probably on a phone or tablet, and do not follow game culture online. They play a lot, but they are not seen.
WORLD 7PLAYING OR READING?
The game does not take the place of the book.
In the second semester, I applied the same method to reading books: "Overall, would you say you read a lot of books?" (F5), and the genres read (F16). Two questions follow. Do reading and gaming have the same social profile? And do players read less?
BONUS STAGE 1Women read more than men
% who read a lot of books
Womenn = 506825,9 %
Menn = 416213,5 %
Chi² = 503.1 · df 3 · p < 0.001 · V = 0.233
CONFIRMED · CLEARAnd 35.2% of men say they do not read, against 19.6% of women.
BONUS STAGE 2Does age weigh as much?
% who read a lot of books
15-25n = 85713,9 %
25-40n = 170616,6 %
40-60n = 296119,5 %
60+n = 370624,2 %
Chi² = 95.8 · df 9 · p < 0.001 · V = 0.059
WEAK LINKOlder people read a little more, the reverse of gaming, but age weighs seven times less.
BONUS STAGE 3Women read more varied books
% reading 5 genres or more
Womenn = 390316,0 %
Menn = 25419,2 %
Chi² = 122.8 · df 3 · p < 0.001 · V = 0.138 · readers only
CONFIRMED · HOLDSThe gap holds in every household type (V from 0.12 to 0.16).
MIRROR · CRAMÉR'S V (0 = NO LINK, 1 = TOTAL)
Gaming × age0,43
Gaming × sex0,06
Reading × sex0,23
Reading × age0,06
Scale: full bar = 0.5.
THE SCORE AND TEST VARIABLESTo measure reading diversity, I coded each genre read as 1, added them up and grouped the score into four classes: none, low (1-2 genres), medium (3-4), strong (5 or more). 13.3% of readers are in the strong class. Then, to check that the gap between women and men was not an effect of family life, I split the sample by household type and re-ran the cross-tabulation in each group: couples with children, without children, people living alone. The link remains everywhere.
BONUS · % WHO READ A LOT OF BOOKS, PLAYERS AND NON-PLAYERS OF THE SAME AGE
PlayersNon-players
15-25
Players13,4 %
Non-players16,0 %
25-40
Players15,4 %
Non-players18,7 %
40-60
Players20,2 %
Non-players18,9 %
60+
Players26,3 %
Non-players23,7 %
At the same age and sex: odds ratio 1.07 (95% interval 0.95-1.21), p = 0.24, not significant.
WHAT THE CHART SHOWSThe two practices are mirror images: the strongest factor for one is the weakest for the other. Gaming separates generations (V = 0.43), reading separates women and men (V = 0.23). And within each age group, players and non-players read in almost the same proportions; after 40, players even read slightly more.
WHAT IT MEANSQuest 3 is false. Overall, players seem to read a little less (18.6% against 21.4%), but only because they are younger, and the young read less. Compared at the same age and sex, the difference disappears. Video games add themselves to other practices; they do not replace them.
WORLD 8BONUSDO PLAYERS GO OUT?
Players go to the cinema more than non-players of the same age.
Last common idea: players would stay at home. I compared players and non-players of the same age on three things: going to the cinema in the year, watching videos on the Internet every day, and preferring leisure at home rather than going out.
% WHO WENT TO THE CINEMA IN THE YEAR
PlayersNon-players
15-25
Players87,5 %
Non-players84,0 %
25-40
Players76,4 %
Non-players70,3 %
40-60
Players69,2 %
Non-players61,8 %
60+
Players58,9 %
Non-players40,9 %
At the same age and sex: odds ratio 1.62 (1.47-1.79), p < 0.001.
% WHO WATCH VIDEOS ON THE INTERNET EVERY DAY
PlayersNon-players
15-25
Players64,7 %
Non-players40,7 %
25-40
Players35,5 %
Non-players22,5 %
40-60
Players15,9 %
Non-players8,6 %
60+
Players3,3 %
Non-players2,8 %
At the same age and sex: odds ratio 1.83 (1.59-2.10), p < 0.001.
PREFERRING HOME21.4% of players prefer leisure at home, against 26.1% of non-players. At the same age and sex, no significant difference (odds ratio 1.04, p = 0.46). Young players prefer home a little more, older players a little less.
THE STRONGEST GAPAmong the over 60s: 58.9% of players went to the cinema in the year, against 40.9% of non-players. Older people who play are, more broadly, older people who stay active.
LINK, NOT CAUSEPlaying does not make people go to the cinema. These results describe profiles: people who play are often people with many cultural practices.
WHAT THE CHART SHOWSAt every age, players went to the cinema more often than non-players, and watch more online video. The gap is small among the youngest, who almost all go to the cinema, and wide among the over 60s.
WHAT IT MEANSQuest 4 is false. Players are not withdrawn; they are rather "omnivores" in the sense of cultural sociology: people who accumulate practices, on screen and off screen. For anyone designing a game, the player is also a moviegoer and a video viewer, with references from several media.
WORLD 9BONUSGOING FURTHER
Is it education, or is it age in disguise? Mostly age.
A cross-tabulation looks at one factor at a time. To separate age, sex and diploma, I ran a logistic regression on the 9,231 respondents: having played in the year, explained by the three factors together. Each effect is then measured with the other two held constant.
BOSS 1The baccalaureate peak
Predicted % · same age and sex
No diploma35,4 %
CAP, BEP39,1 %
Bac42,3 %
Higher education39,1 %
Odds ratio bac = 1.43 (1.23-1.66) · without age: 2.23
HOLDS · SHRINKSThe gap between no diploma and bac drops from 19 points to 7.
BOSS 2The gap between women and men
Predicted % · same age and diploma
Women36,3 %
Men42,0 %
Odds ratio men = 1.35 (1.23-1.48) · p < 0.001
HOLDSSix points remain. Weighted, the gap widens to nine.
BOSS 3Age
Predicted % · same sex and diploma
15-2581,0 %
25-4061,9 %
40-6038,5 %
60+18,4 %
Odds ratio 60+ = 0.05 (0.04-0.06) · ref. 15-25
STILL DOMINANTHolding sex and diploma constant changes almost nothing.
15-25 YEAR-OLDS · % WHO PLAYED BY DIPLOMA
No diploman = 31286,2 %
CAP, BEPn = 9382,8 %
Bacn = 29078,3 %
Higher educationn = 16275,3 %
Among the youngest, the order is reversed.
READING THE MODELReference: a woman aged 15-25 with no diploma. An odds ratio above 1 means more likely to play, below 1 less likely. The pseudo-R² (McFadden) is 0.15: the three factors explain part of the practice, far from all of it. With the survey weights, the conclusions are the same.
WHAT THE CHART SHOWSOnce age is held constant, the baccalaureate peak shrinks from 19 to 7 points, the sex gap stays at six points, and the age gradient barely moves. Among 15-25 year-olds, those with no diploma play the most.
WHAT IT MEANSQuest 2 is false: the diploma effect was mostly an age effect. And "no diploma" does not mean the same thing at every age: at 15-25, it mostly means high school and university students still studying; after 60, people who left school early. A good reminder that a category is not a population.
WORLD 10WHAT IT SAYS TO GAME DESIGN
The player is not a young man by default.
Statistics do not design a game, but they correct the picture of who it is for. Five consequences I draw for anyone designing a game or a digital service around play.
01 · RECRUIT BEYOND THE STEREOTYPEFor user tests, recruiting only young men misses the most regular players: women in their forties and fifties, people over 60.
02 · DESIGN FOR SHORT DAILY SESSIONSA large share of daily players fit the game into their routine. Short sessions, a clear stopping point and no penalty for missing a day fit this use.
03 · READABILITY AND CONTROLSAge is the strongest divide. Text size, contrast, pace and controls are design choices that decide whether older players can come in.
04 · PLAYERS ARE OMNIVORESPlayers also read, go to the cinema and watch videos. References from film, books or online video speak to them; the game is one medium among others in their lives.
05 · WORDS MATTERMany regular players do not call themselves "gamers". In a questionnaire or an interview, asking "do you play on your phone?" catches more than "are you a gamer?".
06 · WEIGHT BEFORE YOU CONCLUDEA raw survey figure can be five points off. Before quoting a market share or a user proportion, check who answered.
WORLD 11LIMITS AND WHAT I LEARNED
What this study can say, and what it cannot.
DECLARED, NOT OBSERVEDAnswers are what people say they do. Playing a little on a phone is easily forgotten, or not counted as "playing".
NO DEVICE, NO GAME TYPEThe data I used do not say on what or what people play. A puzzle on the bus and an evening on a console count the same. That is the next step.
LINK, NOT CAUSEEven controlled for age and sex, an association is not a cause. And the survey is from 2018: practices have changed since, especially with lockdowns.
WHAT I LEARNEDTo distrust the overall figure (weighting), to always compare at the same age (the gap in reading disappears once age is held constant), and to turn a vague question into claims a survey can test. Above all, that a strong image, the young male gamer, can rest on a real but much smaller gap than it suggests.
REFERENCESLebailly, R. (2015). Le jeu vidéo dans la globalisation culturelle. Bulletin de l'Institut Pierre Renouvin, 41, 89-99.Rufat, S., Ter Minassian, H. & Coavoux, S. (2014). Jouer aux jeux vidéo en France. L'Espace géographique, 43, 308-323.Peterson, R. A. (1992). Understanding audience segmentation: from elite and mass to omnivore and univore. Poetics, 21(4), 243-258.Ministry of Culture, DEPS (2018). Survey on the cultural practices of the French (PCF 2018), questionnaire and data.
GAME OVER · CONTINUE ?Three common ideas out of four do not survive the data.
1"Gamers are young men."HALF TRUEAge, yes; sex, much less.
2"The more educated you are, the more you play."FALSEThe peak is at the baccalaureate, and it is mostly age.
3"Video games take the place of books."FALSEAt the same age, players read as much.
4"Players stay at home."FALSEThey go to the cinema more often.
NEXT_CASE_STUDY
QUALITATIVE STUDY
K-ROMANCE
A two-semester qualitative study with K-drama fans: what these series do to their idea of love, and of men.